Free trial
€0
- The full software, limited to 5 cases
- No credit card
PerioMaster brings probing depth, gingival margin, bleeding, plaque, mobility and furcation together on a single dental representation you can read at a glance.
Beta 1-year licence: €300No patient data is stored on our servers.
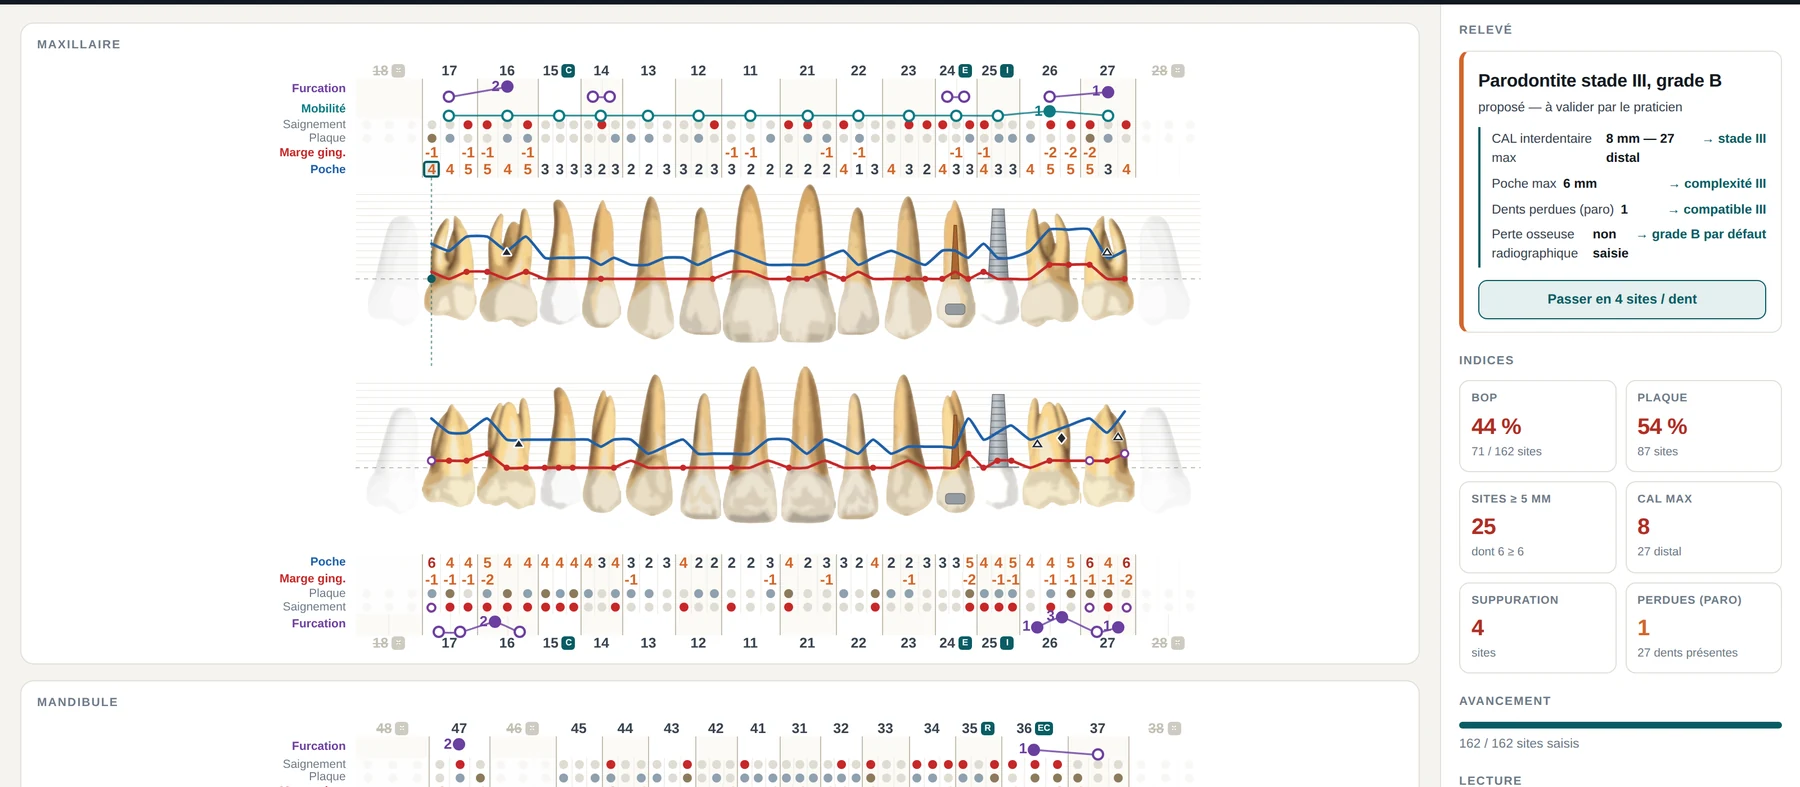
Full chart — demonstration case
This is not about diligence: a full examination means more than a hundred and fifty values, recorded four-handed, usually under chairside pressure.
Six sites per tooth across thirty-two teeth, plus the per-tooth findings.
Nothing on a paper sheet tells you a site was never recorded.
A grid of numbers does not show where the deep areas are.
Mobility here, furcation there, bleeding on another line.
You lay both sheets side by side and read site by site.
Millimetres on a grid do not speak for themselves.
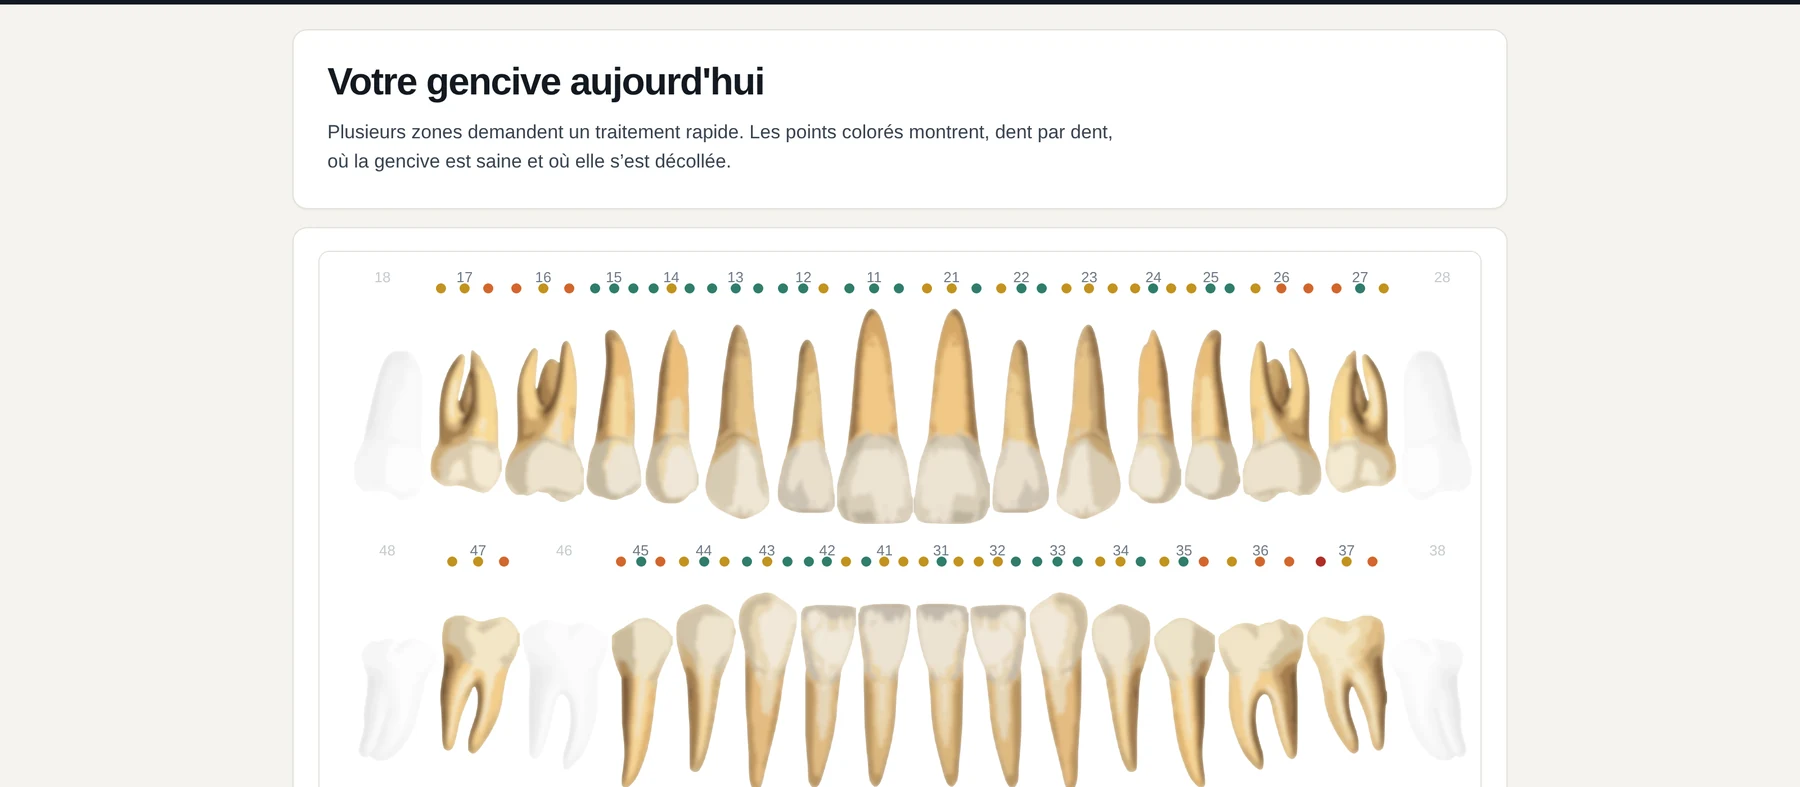
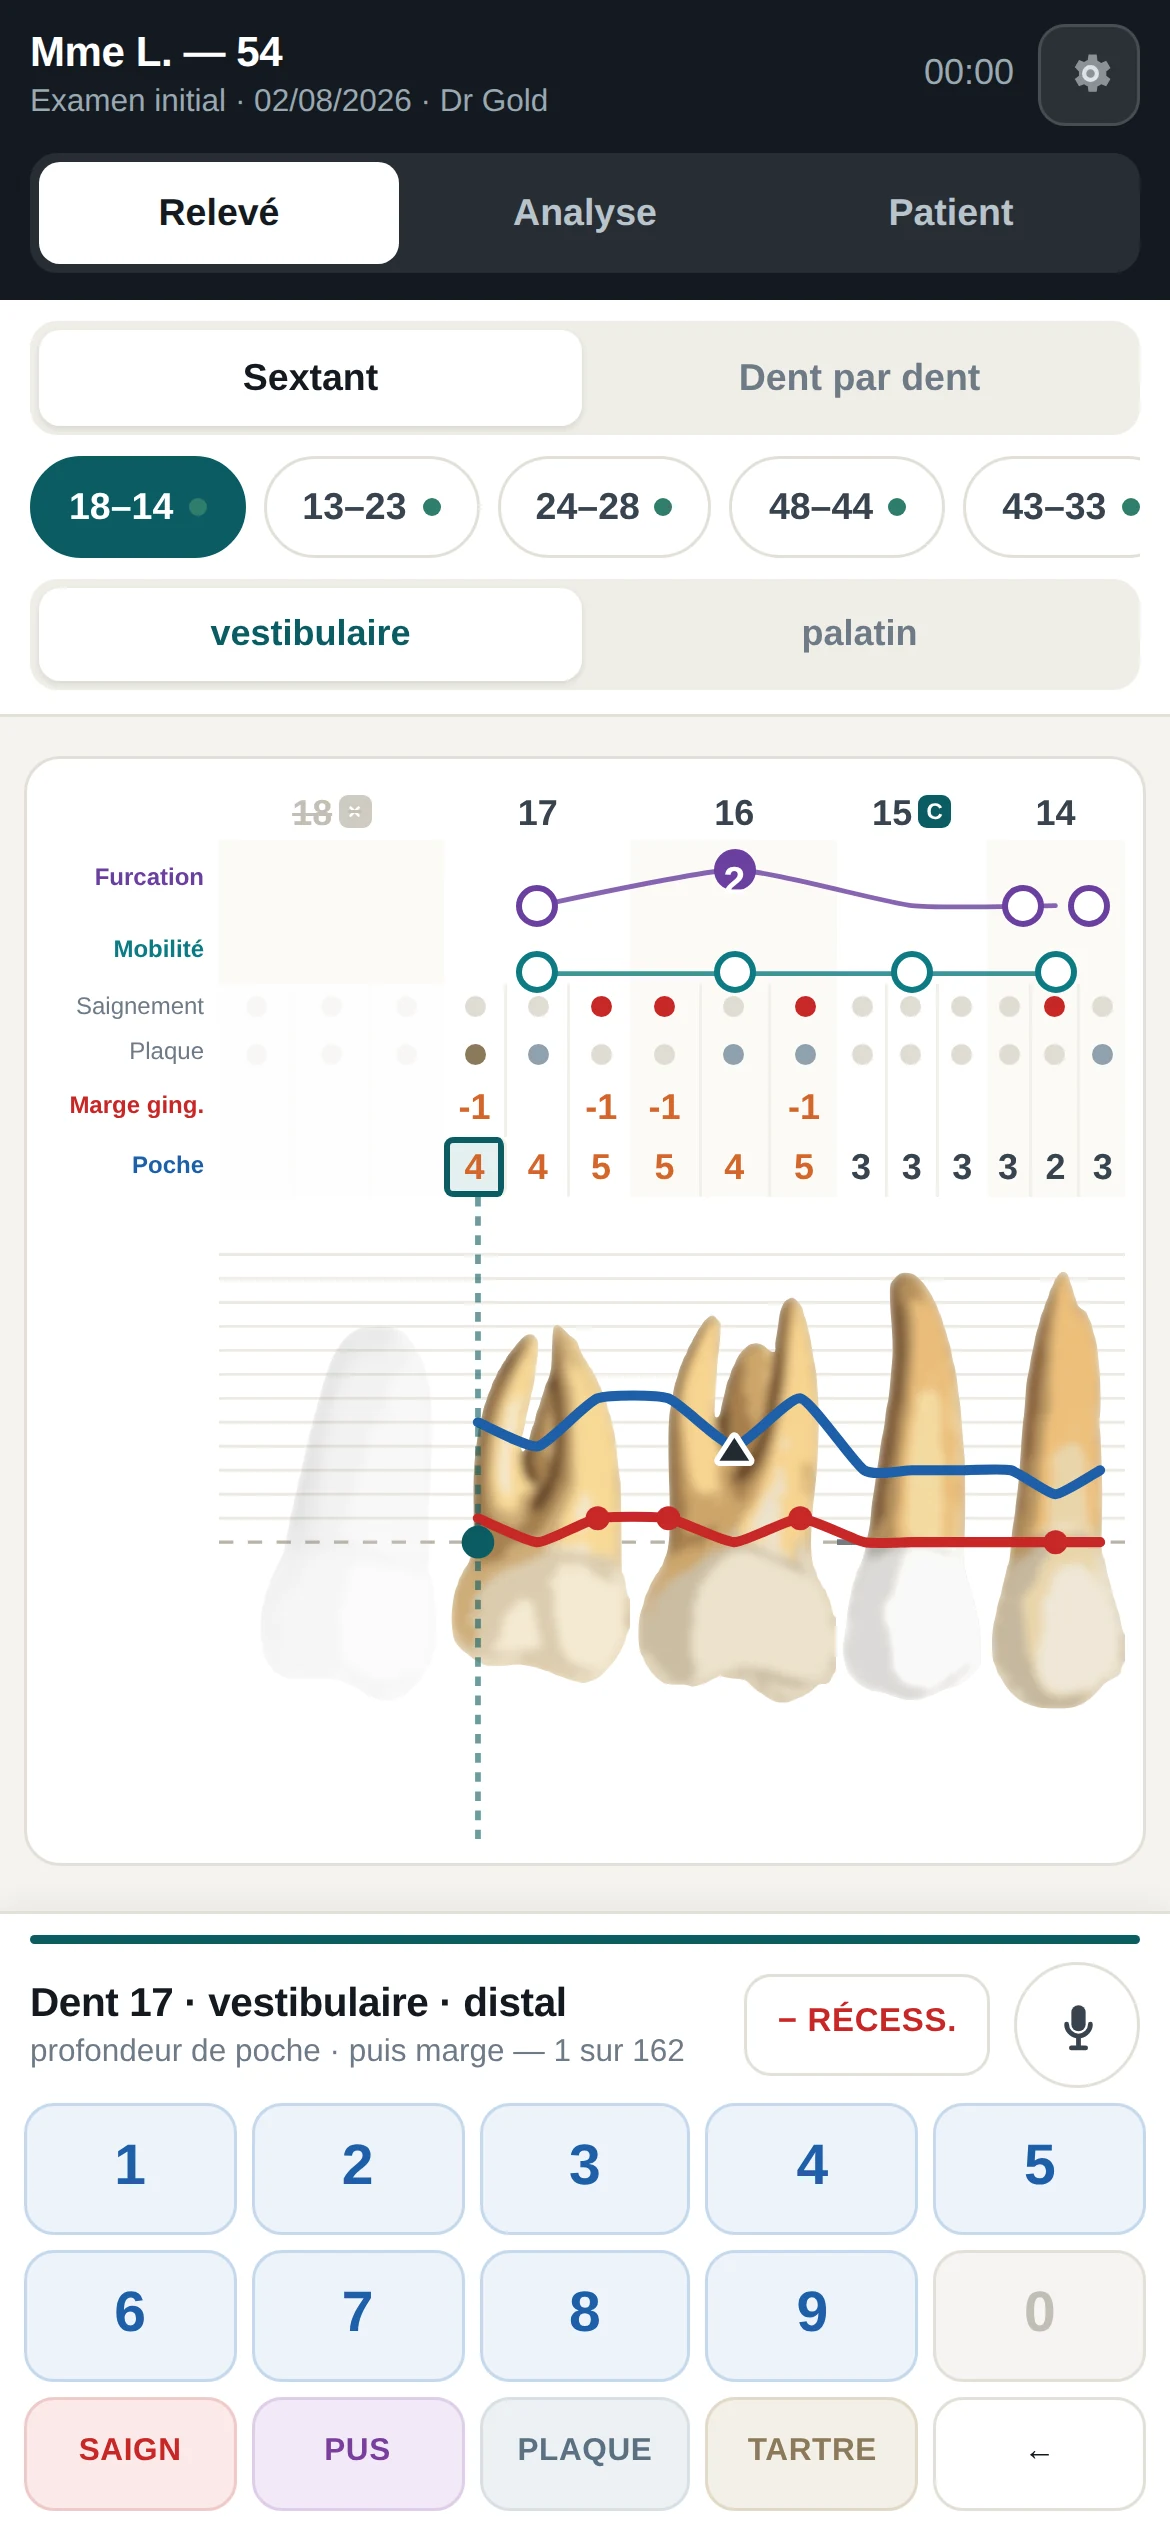
The chart reads like a mouth, not like a table. What you enter draws two curves: the gingival line and the bottom of the pockets. The gap between them is the pocket.
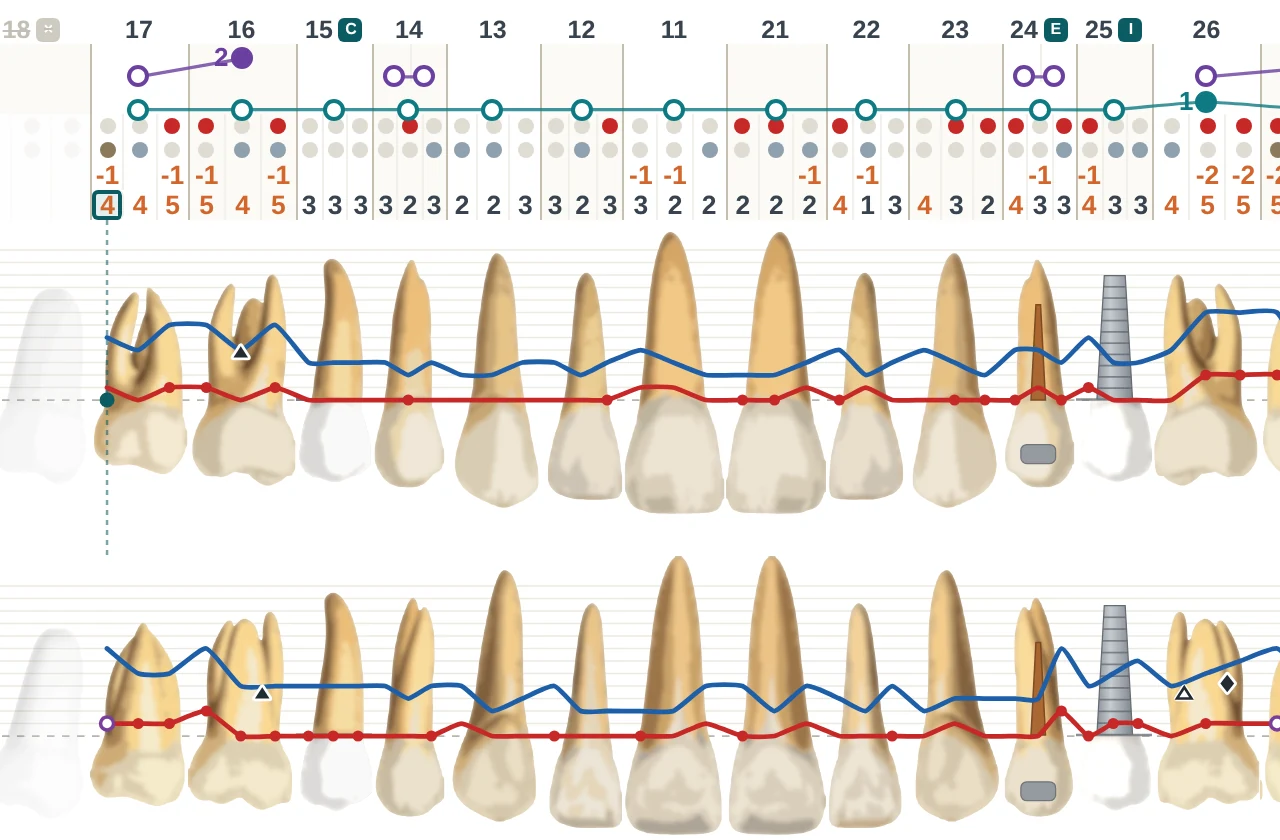
Record probing depths in a structured way and see their distribution around each tooth straight away.
Document the gingival position relative to the cemento-enamel junction, recession included, and keep an organised reading.
Spot the sites that bleed on probing and read the extent of inflammation at a glance.
Record plaque areas and keep a clear representation for follow-up and patient education.
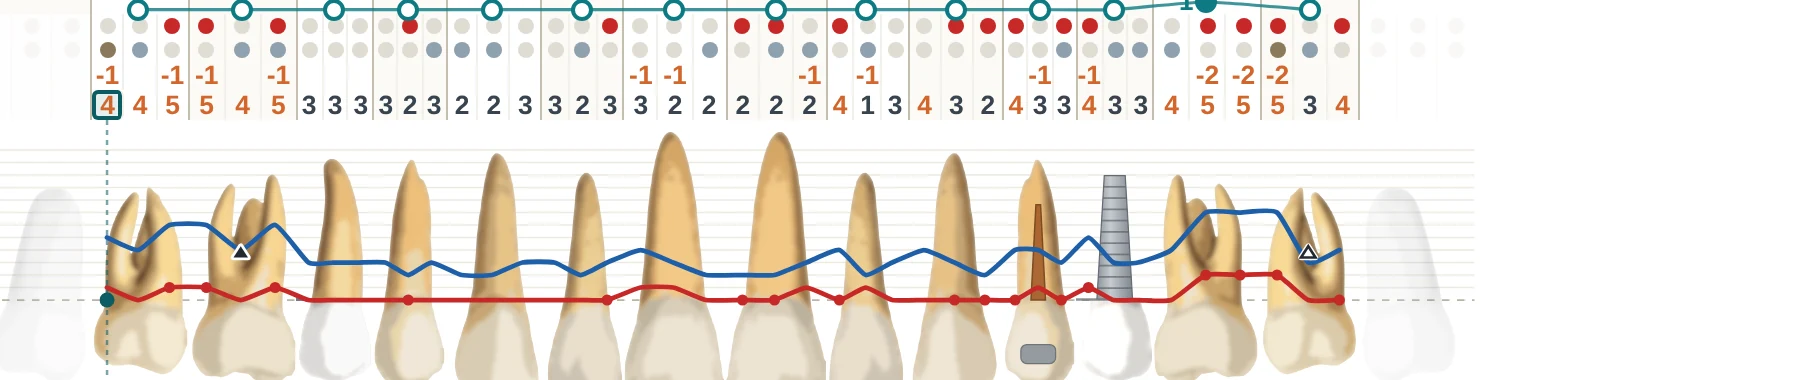

Document tooth mobility with consistent entry that stays readable months later.
Record furcation involvement in the same file, at the anatomically real entries of each tooth.
Every periodontal finding follows one coherent path, from the first site to the last.
Curves and colour markers bring the areas that need attention to the surface.
Progress shows recorded sites against expected sites. It does not remove omissions, but it stops them from being invisible.
Examinations are saved as dated files under the patient's name, on the clinic's own computer.
Practitioner and assistant work from the same representation, with the same conventions.
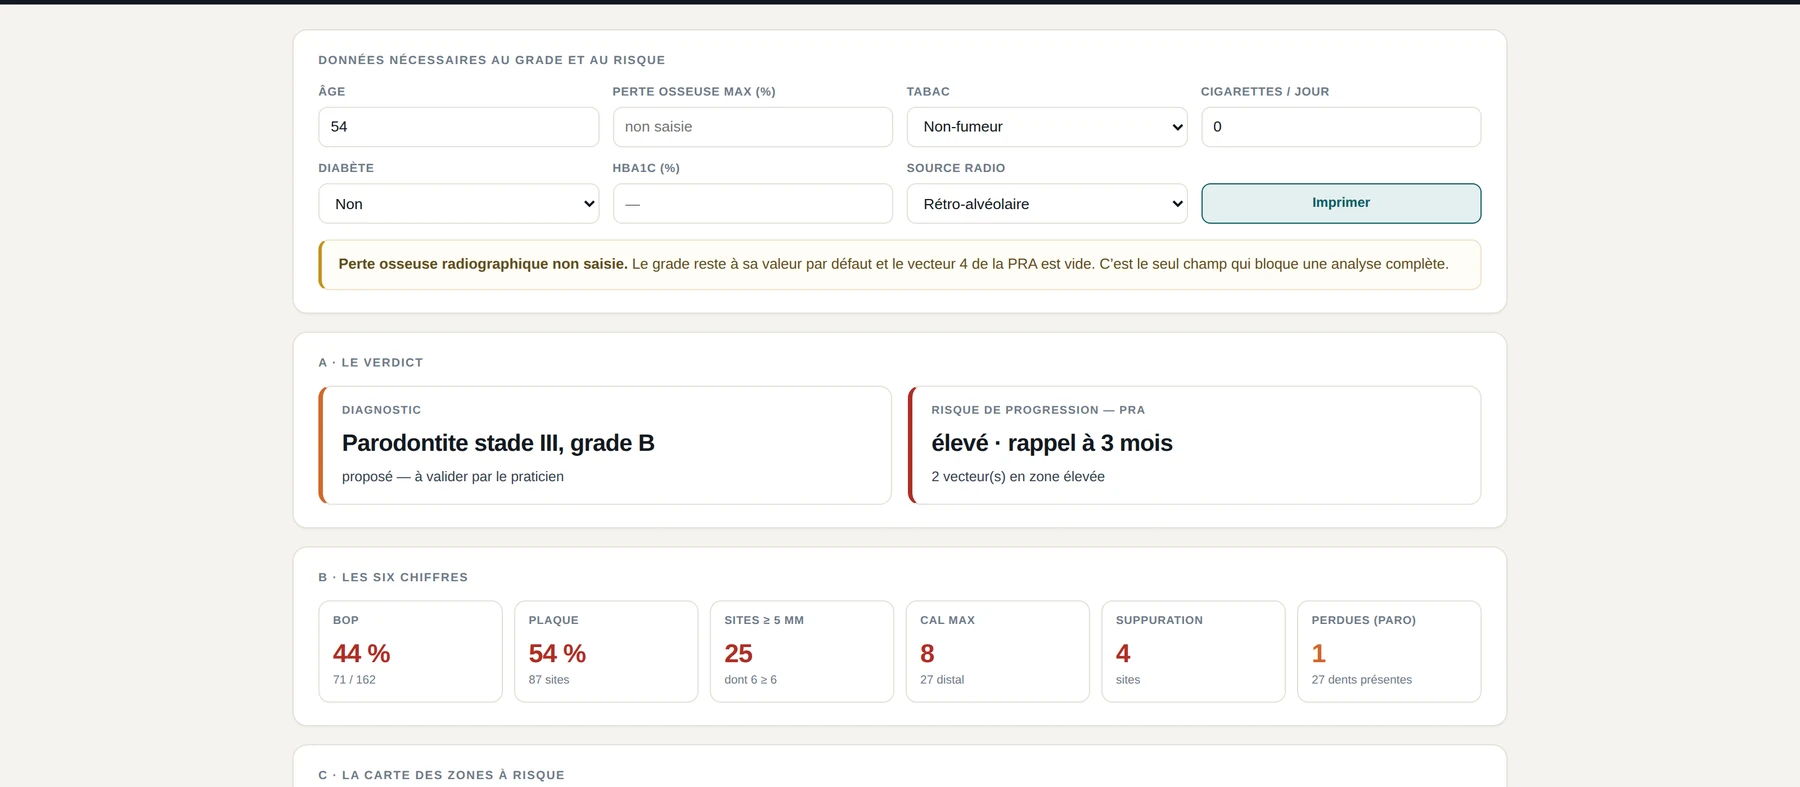
A dedicated view shows the areas involved. It supports the practitioner's explanation; it does not replace it.
Choose the protocol, six or four sites per tooth, and FDI or Universal numbering.
Missing, crown, implant, root-treated, pontic — the relevant sites adjust.
By keyboard or by voice. The cursor advances on its own; bleeding, plaque and calculus do not move it.
Curves, indices and the summary update with every value entered.
Patient view, printing, and saving the record on the clinic's computer.
The free trial and the licence give access to the same software. Only the number of cases changes.
€0
€300 for 12 months
Beta version, provided as is.
The clinical calculation runs entirely in the browser. Measurements and the patient's name never leave the clinic's computer.
No patient table, no examination table
No stored documents: the PDF is produced in the browser
The server only knows clinics, accounts and licences
Open the demonstration chart, or create an account for your clinic.
PerioMaster applies a published classification and shows the reasoning behind every conclusion. The diagnosis remains established and validated by the practitioner.
These settings stay in your browser, on this device. They are never sent anywhere.